WAN Bandwidth in relation to WiFi performance
Introduction
In this document, we will demonstrate the importance of taking WAN Bandwidth into consideration when designing/deploying the Wi-Fi and how WAN Bandwidth affects Wi-Fi throughput measured on a Wi-Fi device.
We can have the best Wi-Fi coverage, and high MCS rates between our wireless device and AP but if WAN Bandwidth is not adequate users will experience poor service and the majority will blame the Wi-Fi design.
It is important to understand what the user requirements are, how many devices we can expect on a particular site and what will average data rate requirement be.
Business model change
Building in this example is a healthcare facility offering mental health services to patients who daily visit therapists and health professionals. The building has 6 floors with around 150 staff and 300 visitors. The average Wi-Fi user count is around 200 daily.
Users started complaining about poor wireless and wired network experience after the COVID lockdown. There were two major contributing factors.
Staff started coming back into the offices, which of course resulted in increased network traffic utilization.
During the lockdown most of the staff worked from home and mental health consultations were shifted from being in person before lockdown to online during the lockdown. After the lockdown staff started returning to the office and accepting patients in person, at the same time there was an increased number of online consultations being performed daily, as this remote consultations model was accepted after the lockdown, which had an effect of increased video and voice traffic utilization.
Gathering data
Measurements have been performed on-site as users started complaining about Wi-Fi slowness affecting their daily productivity.
By examining traffic statistics it was determined that most of the traffic was utilized by network file-sharing and video conferencing platforms like Microsoft Teams and Zoom.
By analyzing Wi-Fi capacity it was determined that Airtime utilization, signal strength, and number of users is not a factor in user performance. Tools used were Cisco Prime Infrastructure and Cisco Wireless Controller 5520.
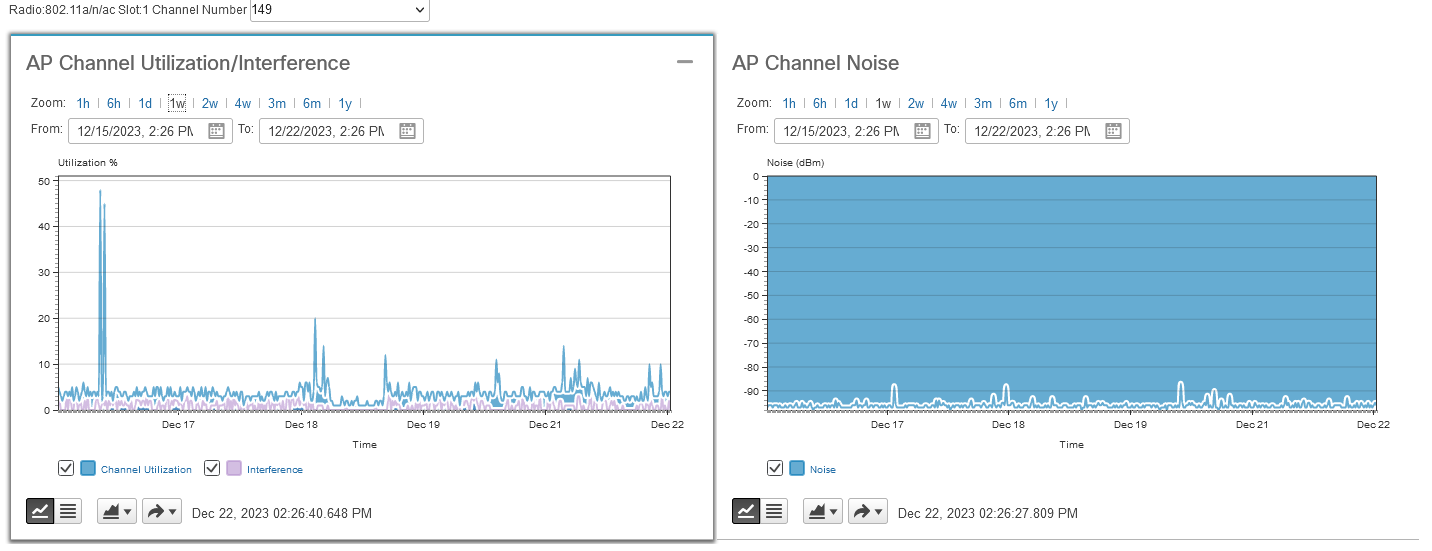
Figure 1. AP Channel Utilization / AP Channel Noise Statistics
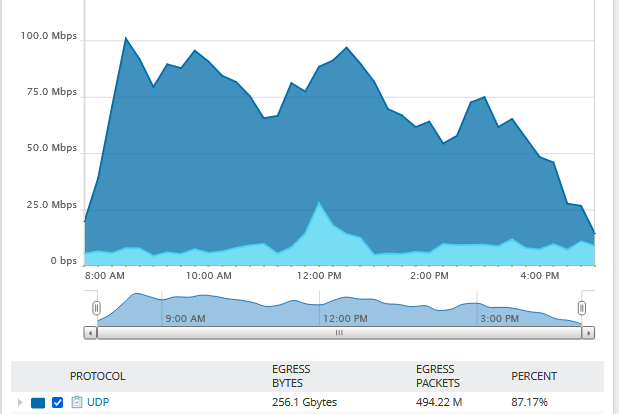
SolarWinds real-time bandwidth monitor and Solarwinds Netflow traffic analyzer tool were used to monitor and examine WAN Bandwidth. It was clear that the site was experiencing more than 75% Bandwidth utilization throughout most of the day hitting 100% utilization at the peak hours, mostly in the morning between 8-9 AM and after lunchtime.
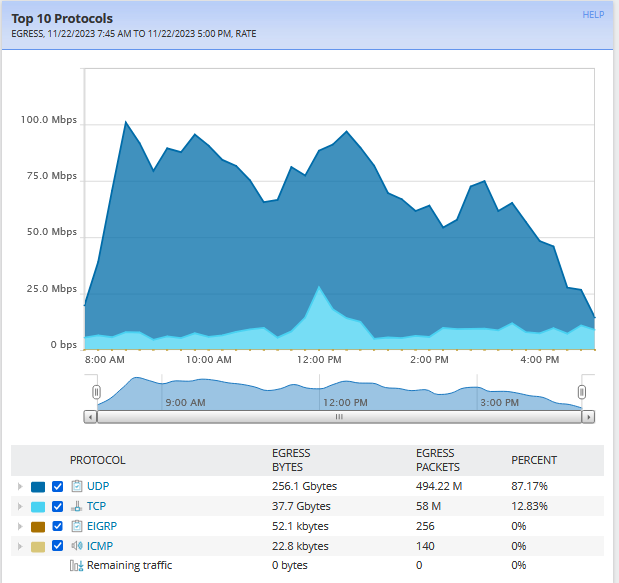
Figure 2. SolarWinds NetFlow traffic statistics
Conducting Throughput tests
In the tests below we will demonstrate a Wi-Fi speed test in relation to WAN Bandwidth.
The first test was performed before the WAN Bandwidth increase and the second one after WAN Bandwidth was increased from 100 Mbit/s to 150 Mbit/s upload and download.
Test 1:
The device tested was an iPhone 12 connected to a Cisco 2802i access point. Distance from the device to an access point was around 4 meters with no physical obstructions.
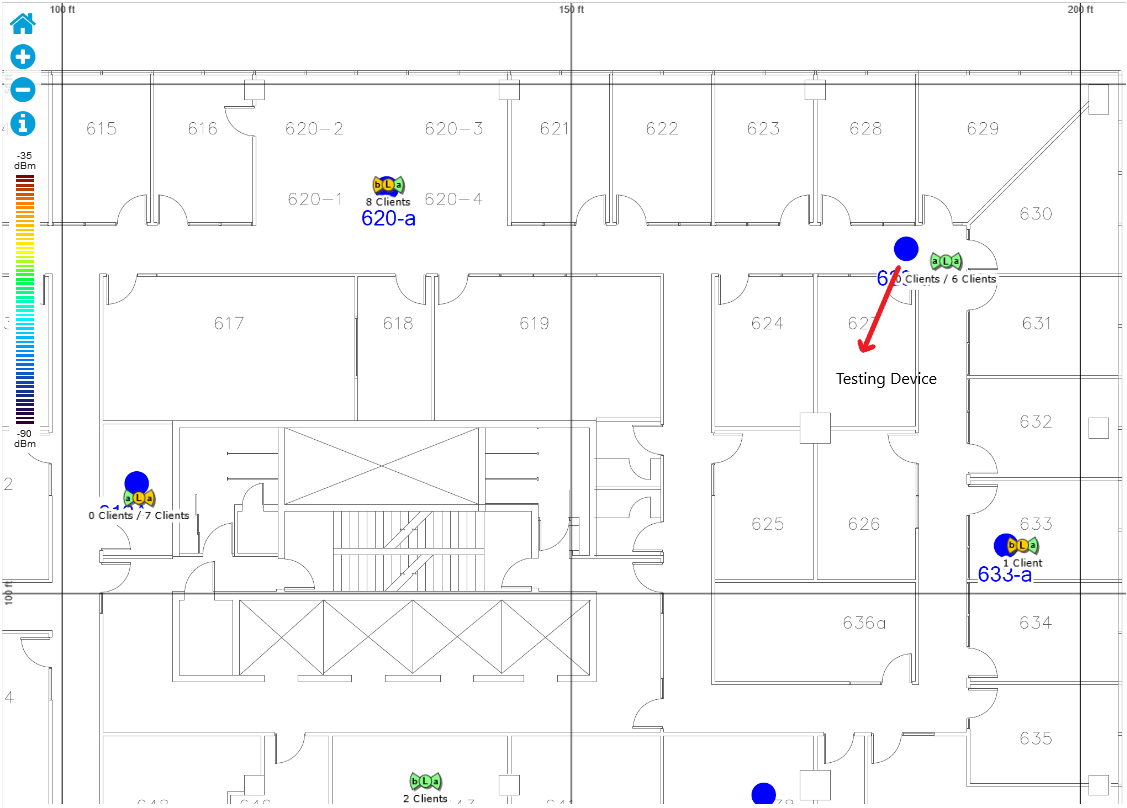
Figure 3. Testing device location in relation to AP
Ekahau sidekick was used to measure channel utilization during measurement. Access Point was on Channel 60 in the 5 GHz band, with 2 % utilization and a noise level of -87 dBm. Client density was low with 6 users connected to AP on the 5 GHz band.
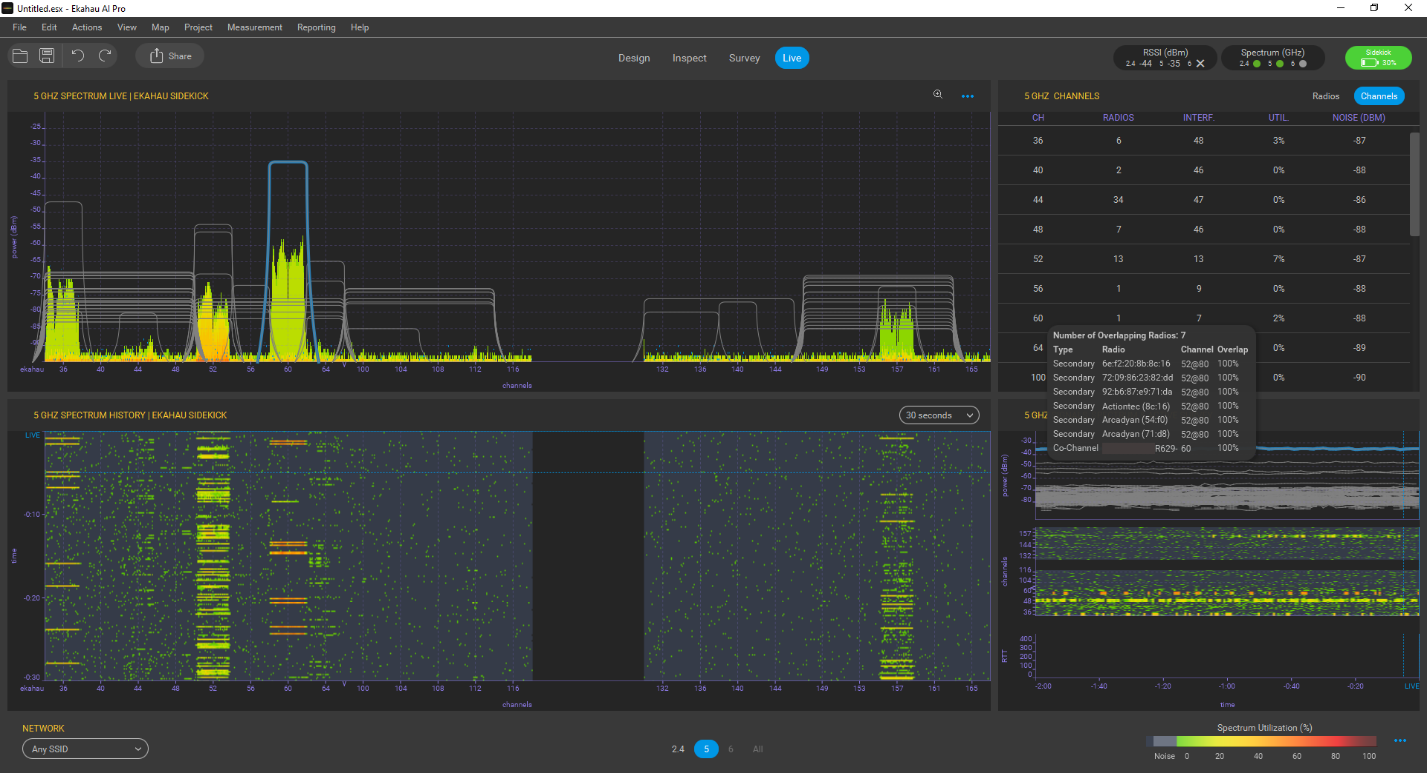
Figure 4. Signal Strength / Channel utilization using spectrum analyzer
Ekahau packet capture with Sidekick #1 was performed during the speed test to verify the negotiated speed between AP and iPhone which was 173.3 Mbit/s with MCS index 8, the determining factor for this speed was SNR which was -48 dBm – -88 dBm = 40 dB.
Looking at the MCS index table we can see that Phy type was: 802.11ac (VHT) with 2 Spatial Streams, 256-Qam modulation, 3/4 Coding rate, 20 MHz channel Width, 0.4 us Guard Interval, which all resulted as 173.3 Mb/s data rates.
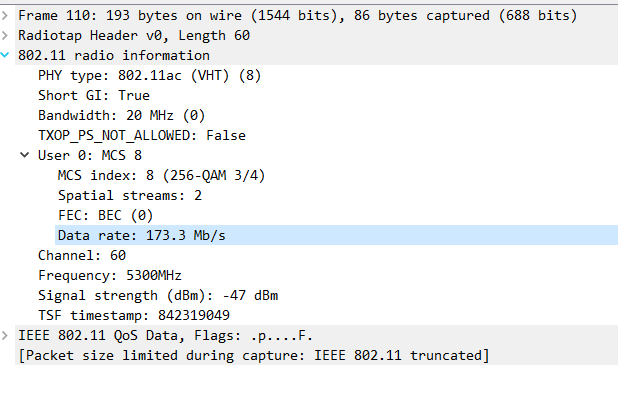
Figure 5. Data rate
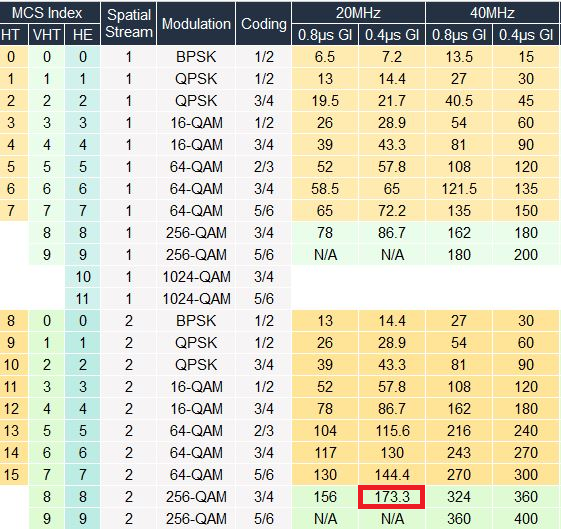
Figure 6. MCS table
Packet capture indicates that AP and iPhone were capable of sending data frames at the rate of 173.3 Mbit/s however, we need to keep in mind that in spite of the 173.3 Mbit/s negotiated data rate, real throughput between Access Point and client device will be around 50 percent lower, because of the management overhead and other communicating stations on the shared RF medium.
Another thing to keep in mind is that PHY information is sent at the lowest supported data rate in the BSS after which MAC frame is sent at the data rate indicated. As in this example, the PHY information may be transmitted at 6 Mbps in 5 GHz networks, after which the MAC frame is then sent at 173.3 Mbps.
iPhone nPerf test before WAN upgrade
Finally, a full nPerf test was performed on the iPhone while monitoring Real-Time Bandwidth with the results below.
Measured average Download speed was around 27 Mbit/s, Upload speed was around 22 Mbit/s.
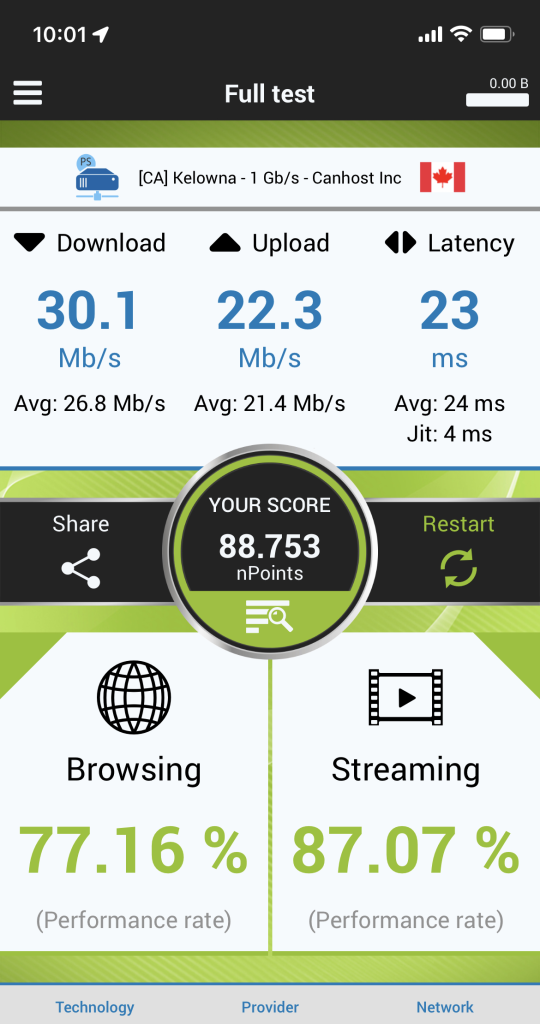
Figure 7. nPerf iPhone test
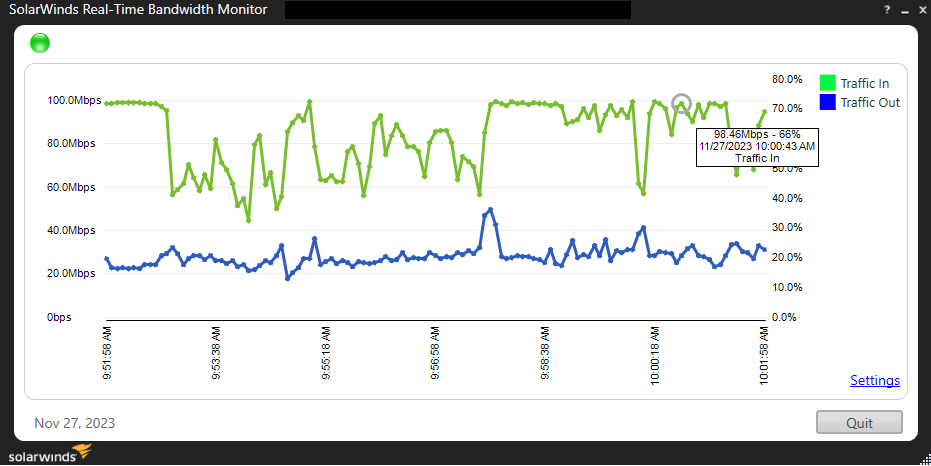
Figure 8. Real-Time Bandwidth monitoring
Laptop iperf test before WAN upgrade
Another test was performed on a laptop with iperf at a different location in the building, this time relevant client connection information was collected from the Cisco 5520 Wireless Controller interface. We can see that the received signal strength was -40 dBm, negotiated connection speed 173 Mbit/s with Phy type: 802.11ac (VHT) and 2 Spatial Streams.
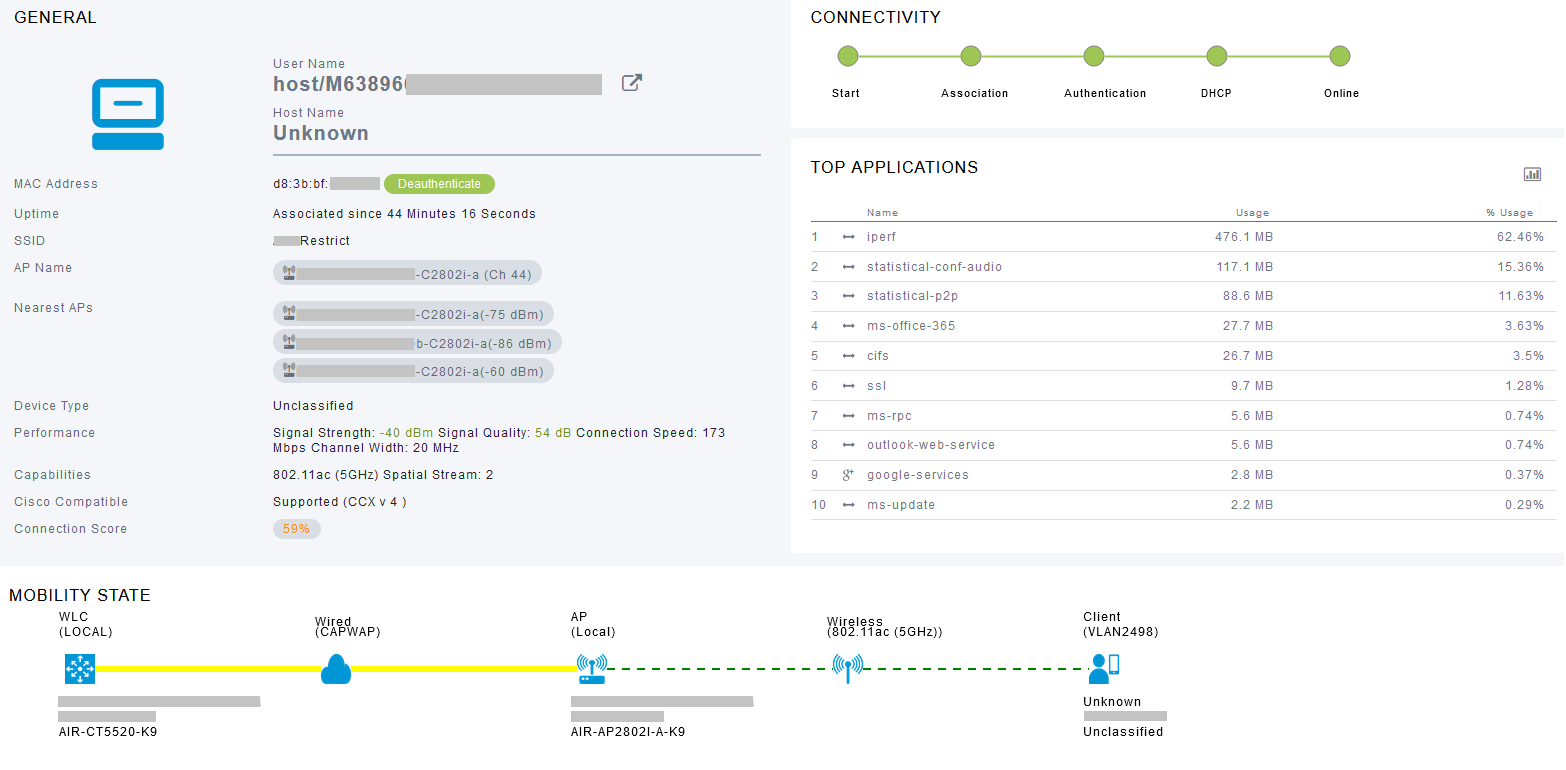
Figure 9. Cisco 5520 Wireless Controller client statistics
In this test, UDP achieved download speed was 34.3 Mbit/s
Iperf initiated a connection from the server at 10.106.83.81 to a client, using UDP port 5201, with a target bandwidth of 100 Mbps in a time interval of 10 seconds and a UDP payload size of 1300 bytes.
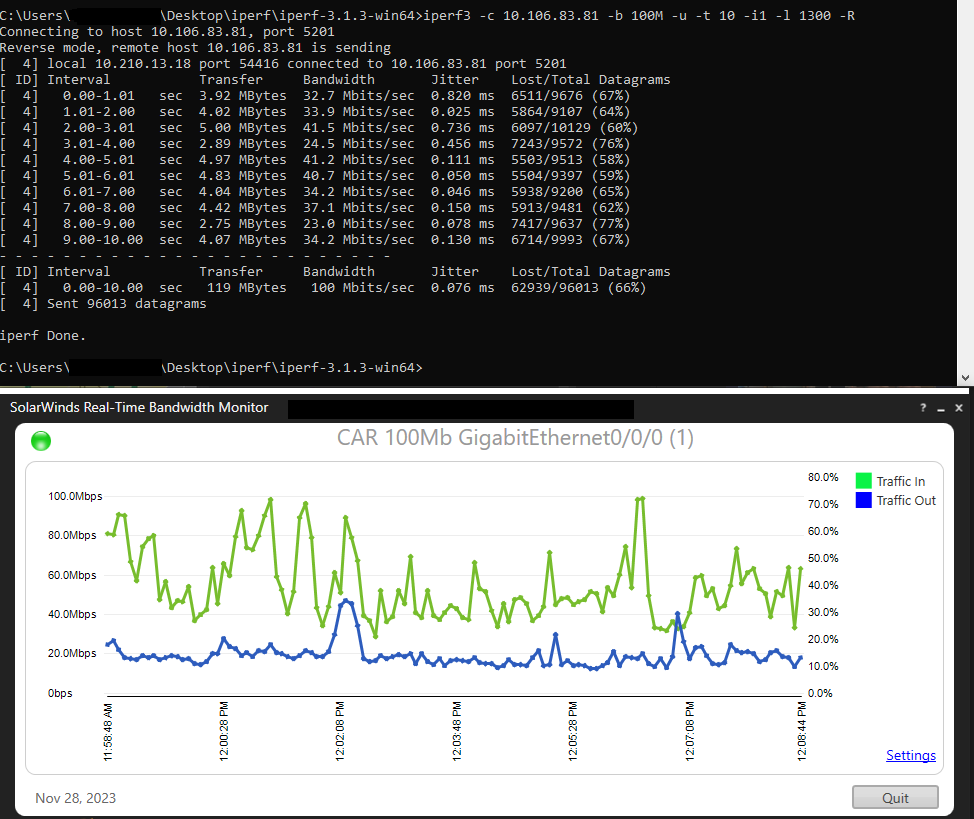
Figure 10. Laptop iperf test with Real-Time Bandwidth monitoring
iPhone nPerf test after WAN upgrade
The same test was performed after the WAN Bandwidth upgrade from 100 Mbit/s to 150 Mbit/s in a similar Wi-Fi environment at the same location, with the results below.
WAN Bandwidth increase had a positive effect on client speed, which in this case was around 65 Mbit/s Download and 34 Mbit/s Upload.
![]()
Figure 10. iPhone nPerf test after WAN upgrade
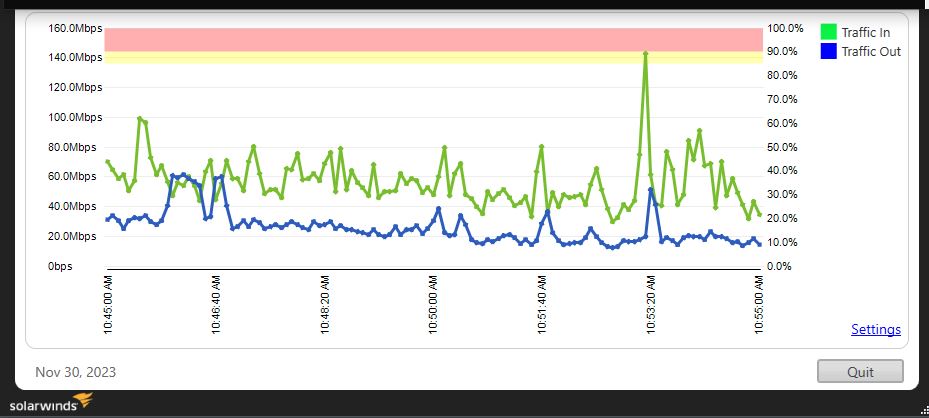
Figure 11. Real-Time Bandwidth monitoring after WAN upgrade
Post WAN Upgrade
User experience after WAN Upgrade was positive there was no audio/video lagging and cutting out reported, which was mostly noticeable during peak hours as the network bandwidth is shared between all the users on site.
Conclusion:
We can see that there are many factors affecting real clients throughout with WAN Bandwidth playing a very important role. In this example, our Wi-Fi throughput was double compared to the prior WAN Bandwidth increase.
Another important factor in designing a network for voice and video-grade services is the proper configuration and implementation of QoS throughout the network. This will allow prioritizing packets that are more latency-sensitive, which can then be processed and forwarded first regardless of the arrival time.
Bandwidth represents how much information a network can transfer in a given period of time and the rate at which data can be transmitted between two endpoints. Speed is the actual amount of data that is being transferred per second. Network Throughput refers to the actual amount of useful user data that is successfully transmitted over a network or communication channel in a given period of time.
Selecting the right bandwidth level for your specific needs is essential to ensure optimal performance and a positive user experience.
Wi-Fi design and environment can be perfect but if the WAN Bandwidth has not been planned and implemented adequately users will be experiencing degraded services with the majority blaming the Wi-Fi. Another thing to keep in mind is that your network environment and user requirements can change over time. Monitoring network performance, and throughput is also an important factor in maintaining your network and having happy users.
Reference material:
https://www.solarwinds.com/resources/it-glossary/network-bandwidth
Certified Wireless Network Administrator Official Study Guide – David D. Coleman (Author), David A. Westcott (Author)
Throughput vs Bandwidth: Understanding the Difference Plus Tools